Measure a shaft with a micrometer and you get a number. What you do not get is how far that number could be from the true diameter. That second number is the measurement uncertainty, and without it the first one cannot be compared with a tolerance, with another lab, or with last month's reading.
The method below is the standard one, from the Guide to the Expression of Uncertainty in Measurement (the GUM). The numbers are a worked example: a nominal 25 mm steel shaft and a digital micrometer that reads to 0.001 mm.
Uncertainty is not error
Error is the difference between your result and the true value. You never know it, because you never know the true value. If you knew it, you would correct for it.
Uncertainty is the width of the range the true value probably sits in, given everything you know about how you measured. It is something you can work out. Each source of doubt is turned into a standard uncertainty u, which is a standard deviation, and then they are combined.
Type A: from the readings
Ten readings, in mm: 25.012, 25.015, 25.011, 25.014, 25.013, 25.012, 25.016, 25.013, 25.012, 25.014.
The mean is 25.0132 mm. The sample standard deviation is s = 1.55 µm. That is the scatter of one reading. The result is the mean of ten, and the mean scatters less, by √n:
u_A = s / √n = 1.55 / √10 = 0.49 µm
Anything evaluated by statistics on repeated readings is called type A.
Type B: from everything else
Some doubt does not show up in the scatter at all. If the micrometer reads 1 µm high, it reads 1 µm high every time, and ten readings agree with each other perfectly about the wrong answer. These sources are evaluated from other information, and are called type B.
Calibration. Suppose the micrometer's calibration certificate gives an expanded uncertainty of 2 µm at k = 2. Certificates quote the expanded value, so divide it back down: u = 2 / 2 = 1.00 µm.
Resolution. The display shows 0.001 mm, so a reading of 25.013 means anything from 25.0125 to 25.0135. That is a half-width of 0.5 µm with no reason to prefer any value inside it. For a flat, rectangular distribution like that, u = half-width / √3 = 0.5 / √3 = 0.29 µm.
Temperature. Steel grows by about 11.5 µm per metre per kelvin. If the part's temperature is only known to within ±2 K of the reference 20 °C, the 25 mm shaft could be up to 25 × 11.5 × 10⁻⁶ × 2 = 0.58 µm off. Treated as rectangular again, u = 0.58 / √3 = 0.33 µm.
The budget
Independent standard uncertainties do not add. Their squares do, the same way variances add:
u_c = √(1.00² + 0.49² + 0.33² + 0.29²) = 1.20 µm
| Source | Type | u, µm | Share of u_c² |
|---|---|---|---|
| Calibration certificate | B | 1.00 | 70% |
| Repeatability, ten readings | A | 0.49 | 17% |
| Temperature, ±2 K | B | 0.33 | 8% |
| Resolution, 0.001 mm | B | 0.29 | 6% |
| Combined | 1.20 | 100% |
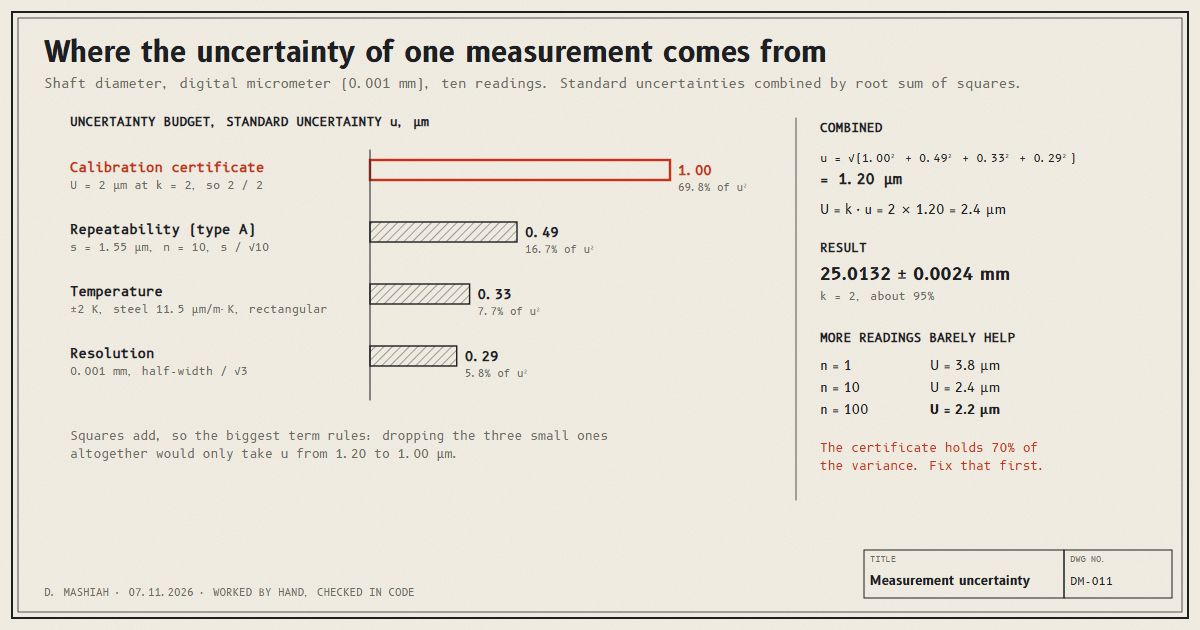
Adding them straight would give 2.11 µm, which overstates it, because four independent errors are very unlikely to all land at their worst in the same direction.
Expanded uncertainty and the result
A standard uncertainty is one standard deviation, about a 68 percent range for a normal distribution. Results are usually reported wider, multiplied by a coverage factor k. With k = 2 the range covers about 95 percent:
U = k · u_c = 2 × 1.20 = 2.4 µm
The result is reported as d = 25.0132 ± 0.0024 mm, with k = 2, for about 95 percent coverage. Always state k. Without it, a reader cannot tell a 68 percent range from a 95 percent one.
What the budget tells you to fix
This is the useful part. Because squares add, the largest term rules. Remove the other three entirely and u_c only drops from 1.20 to 1.00 µm. It is the same arithmetic that makes RMSE punish one big miss: squaring lets the biggest contribution dominate.
So the instinct to take more readings barely helps here. One reading gives U = 3.8 µm. Ten give 2.4 µm. A hundred give 2.2 µm, a lot of extra work for almost nothing, because repeatability was never the main term.
The thing to improve is the calibration: a better calibrated instrument, or checking the micrometer against a gauge block of known size just before use. A budget is worth writing even when you never report it, because it tells you where the effort should go.
References
- JCGM 100:2008. Evaluation of measurement data: Guide to the expression of uncertainty in measurement (GUM). Joint Committee for Guides in Metrology, 2008.
- Taylor, J. R. An Introduction to Error Analysis, 2nd edition. University Science Books, 1997.