Every error metric turns a list of misses into one number, and each one does it by deciding how much a big miss counts compared with a small one. MAE counts every unit of error the same. MSE and RMSE count big misses more. That single choice is most of what separates them.
The example below is a demand forecast, because the difference is easy to feel there. When you sell perishables, being off by one unit every day and being off by five units once are very different problems.
The three formulas
For each case, the error is the prediction minus the true value, e = ŷ − y. Over n cases:
MAE, mean absolute error: the average size of the miss, MAE = Σ|e| / n.
MSE, mean squared error: the average of the squared misses, MSE = Σe² / n. Squaring makes every error positive and makes large ones count far more. Its units are squared, units of demand squared here, which is why it is hard to read.
RMSE, root mean squared error: the square root of MSE, RMSE = √MSE. That brings it back to the units of the data while keeping the extra weight on large misses.
Five days, two forecasts
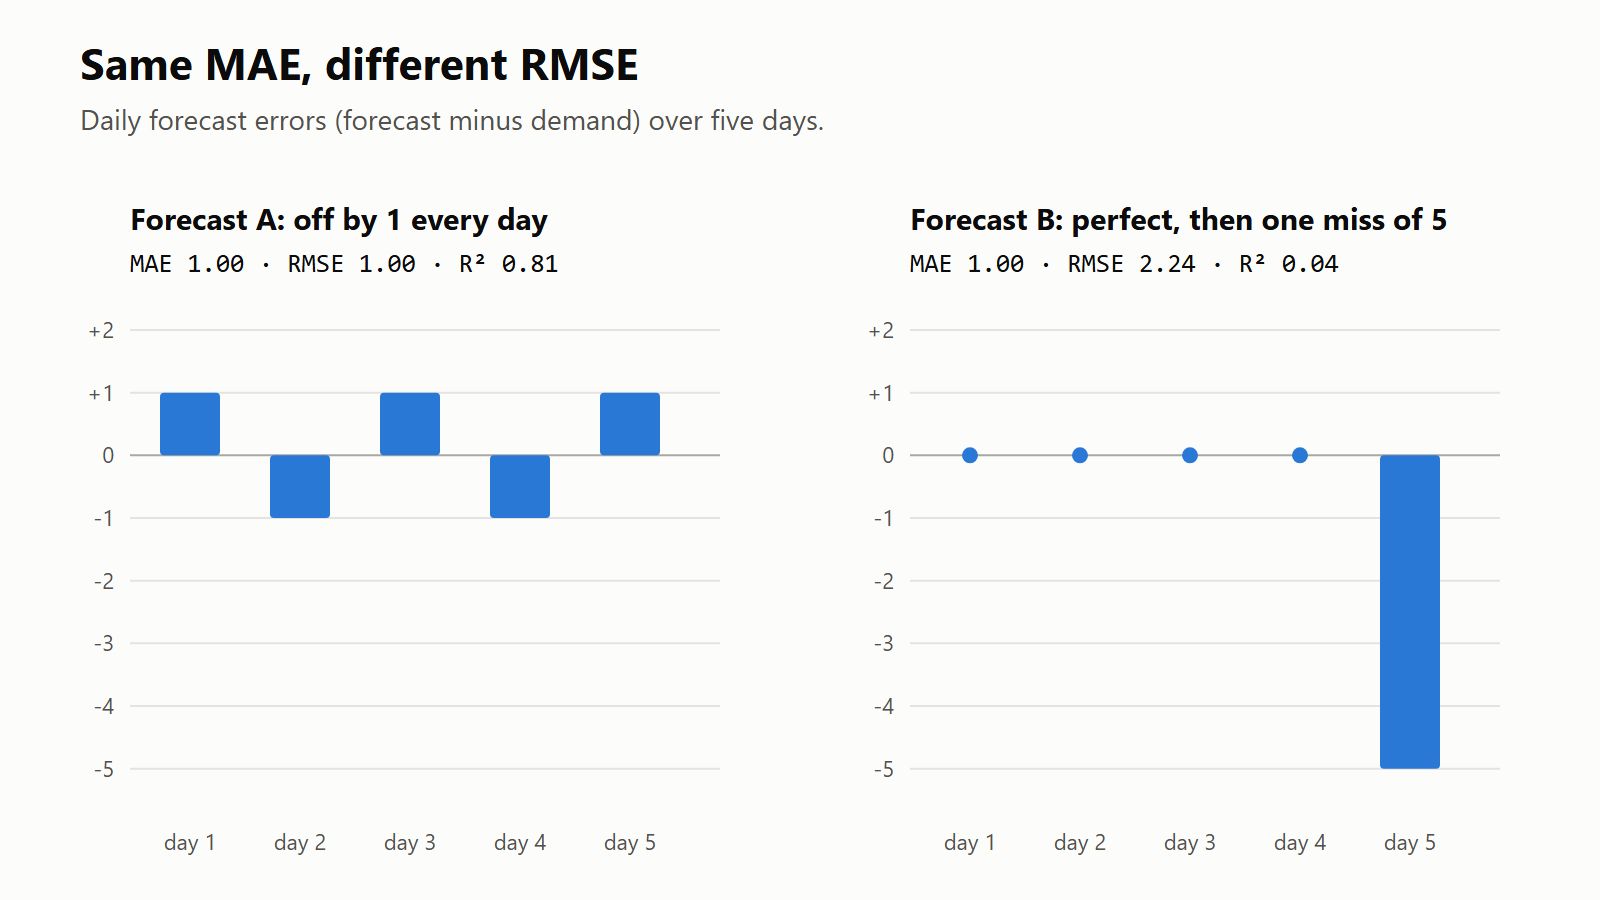
True demand over five days was 12, 9, 15, 10, 14. Forecast A predicted 13, 8, 16, 9, 15. Forecast B predicted 12, 9, 15, 10, 9.
| Metric | Forecast A | Forecast B |
|---|---|---|
| Errors | +1, −1, +1, −1, +1 | 0, 0, 0, 0, −5 |
| MAE | 1.00 | 1.00 |
| MSE | 1.00 | 5.00 |
| RMSE | 1.00 | 2.24 |
| R² | 0.81 | 0.04 |
By MAE the two forecasts are identical: both miss by one unit per day on average. A misses by one every day. B is perfect for four days and then misses by five.
RMSE separates them. A's squared errors are all 1, so its MSE is 1 and its RMSE is 1. B's squared errors are four zeros and a 25, so its MSE is 25 / 5 = 5 and its RMSE is √5 = 2.24. One bad day more than doubled it.
What R² adds
R² compares the model's MSE with the variance of the true values, which is the MSE of a forecast that always says the average. Here the average demand is 12 and the variance is 5.2, so R² = 1 − MSE / 5.2.
That gives 0.81 for A and 0.04 for B. B is barely better than predicting 12 every day, because its one miss of 5 costs almost as much squared error as the spread of the demand itself. R² is built on squared error, so it inherits RMSE's view of big misses. I used it throughout a note on out-of-distribution failure, where it goes below zero.
Which one to use
Use MAE when every unit of error costs about the same, and when you want a number people can read directly: off by one unit a day. It is also less swayed by a few odd cases, which is good when they are bad data and bad when they are the cases that matter.
Use RMSE when a large miss is disproportionately expensive. Running out of stock on your busiest day, or a stiffness prediction that is wildly wrong for one design, is that kind of error. RMSE is also what least-squares fitting minimises, so it is the natural score for a model trained that way.
Report both when you can. RMSE is always at least as large as MAE, and they are equal only when every error has the same size, as in forecast A. A large gap between them says the error is concentrated in a few cases, and those are the cases to look at.
The one MAE and RMSE both miss
Neither metric shows direction. Forecast A's errors average +0.2, close to balanced. Forecast B's average −1: every miss it makes is an under-forecast. For perishables, a forecast that always runs short means empty shelves on the days demand is highest, and its sales history then hides that demand, as worked through in a note on censored demand.
So add the mean error, the bias, next to MAE or RMSE. Size tells you how wrong a forecast is. Bias tells you which way, and that is often the part that decides what to do.