A model's error on the rows it trained on says little about how it will do on new ones. It has already seen those rows. So you hold some back, train on the rest, and score the model on the held-out part. That is the train/test split, and the score on the test set is the estimate of how the model will do on data it has not seen.
The part that gets less attention is that this estimate is itself a measurement, with its own uncertainty. This note measures that uncertainty directly, on data small enough to try every split.
The setup
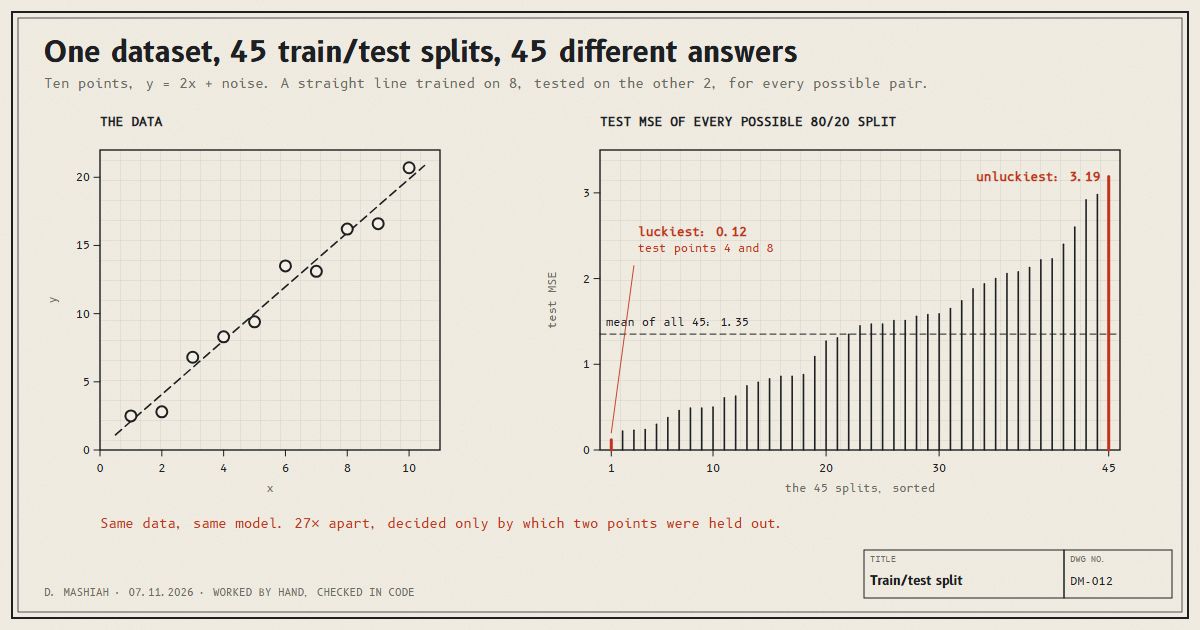
Ten points, x = 1 to 10, with y = 2x plus a fixed bit of noise: y = 2.5, 2.8, 6.8, 8.3, 9.4, 13.5, 13.1, 16.2, 16.6, 20.7. The model is a straight line fitted by least squares. The score is mean squared error, MSE, on the test points.
An 80/20 split trains on 8 points and tests on 2. There are 45 ways to choose which 2, so I ran all 45.
What the 45 splits said
| Over all 45 splits | Test MSE |
|---|---|
| Luckiest split, test points 4 and 8 | 0.12 |
| Median | 1.45 |
| Mean | 1.35 |
| Unluckiest split, test points 6 and 10 | 3.19 |
The model did not change and the data did not change. The score moved by a factor of 27 because two test points are a tiny sample, and whether they happen to sit close to the line or far from it decides everything.
For scale, the error on the training data itself, fitting all ten points, is 0.83. The luckiest split reports a test error seven times lower than that, which would read as a model that does better on new data than on the data it learned from. It does not. The split was lucky.
Seed shopping
In code, the split is usually chosen by a random seed. Try a model, the score is disappointing, change the seed, try again. Nothing about that feels like cheating. But with 45 possible answers spread over a factor of 27, picking the seed that gives a good number is picking the answer.
The fix is to fix the seed before looking at any result and never touch it, or, better, to stop relying on one split.
Leakage: the test set has to stay unseen
The split only measures anything if the test rows have no influence on training. The common way to break that is to prepare the data before splitting it: scaling every feature by the mean and standard deviation of the whole dataset, filling missing values from the whole column, or choosing features by how well they correlate with the target across all rows. Each of these lets the test rows leave a fingerprint on the model.
The rule is to split first, then fit every preparation step on the training rows only, and apply it unchanged to the test rows. The same goes for rows that are not really independent, such as several measurements from the same machine or the same patient. If one lands in training and its twin in testing, the model is being tested on something it has almost seen. That case is worked through in the cross-validation note, where the same model scores R² 0.80 or −0.67 depending on it.
When one split is enough
The spread comes from the test set being small. An average over n test points scatters less as n grows, roughly as 1 / √n, so a test set four times larger has about half the scatter. With hundreds of thousands of rows, one fixed split gives a stable number, and it is what most large projects do.
With tens or hundreds of rows, use every row as a test point once instead. Averaging the test error over all 45 splits here gives 1.35. Leave-one-out, which tests on each point in turn, gives 1.32. Either is a far steadier estimate than any single 80/20 split, and k-fold cross-validation is the practical version of the same idea.
And whichever you use, report the spread with the score, not just the score. A test error of 1.35 means little until you know that one split alone could have said 0.12 or 3.19.
In a real competition the same noise decided rankings: identical code scored 6.241, 6.259 and 6.368. That is in the note on how my validation ranked five models backwards.