MAE and RMSE both throw away the sign of the error. A forecast 2 too high and a forecast 2 too low score the same. For deciding how much stock to order, that sign is most of what matters: too high and you throw things away, too low and you lose sales you never see.
Forecast bias is the measure that keeps the sign. This note works it through on eight days of demand.
Two forecasts, eight days
Demand over eight days: 12, 9, 15, 10, 14, 11, 13, 10, a total of 94. Error is forecast minus actual, so a positive error means the forecast was too high.
| Day | 1 | 2 | 3 | 4 | 5 | 6 | 7 | 8 |
|---|---|---|---|---|---|---|---|---|
| Demand | 12 | 9 | 15 | 10 | 14 | 11 | 13 | 10 |
| Forecast H | 15 | 10 | 17 | 13 | 15 | 13 | 16 | 11 |
| Error H | +3 | +1 | +2 | +3 | +1 | +2 | +3 | +1 |
| Forecast N | 15 | 7 | 12 | 12 | 15 | 10 | 10 | 13 |
| Error N | +3 | −2 | −3 | +2 | +1 | −1 | −3 | +3 |
By the usual accuracy scores, H is the better forecast. Its MAE is 2.00 against N's 2.25, and its RMSE 2.18 against 2.40. Pick by MAE and you pick H.
Bias: keep the sign
Bias is the mean error, with the signs left in:
bias = Σ (forecast − actual) / n
For H the errors sum to +16, so the bias is +16 / 8 = +2.00 units a day. For N they sum to 0, so its bias is 0.00. Its misses go both ways and cancel. H's all go one way.
As a share of demand, percent bias is Σ (forecast − actual) / Σ actual = 16 / 94 = 17.0 percent. Forecast H plans for 17 percent more than was sold. If the forecast sets the order, that is 17 percent of stock bought for nobody.
Watch the sign convention when comparing tools. Some define error as actual minus forecast, which flips the sign of everything here.
The tracking signal
Bias over a fixed window answers the question after the fact. The tracking signal watches for it as the days come in: the running sum of errors divided by the running mean absolute deviation, MAD, which is the MAE so far.
TS = Σ errors / MAD
An unbiased forecast keeps pulling the running sum back toward zero, so the signal wanders around zero. A biased one keeps adding to it. A common alarm is a tracking signal outside ±4.
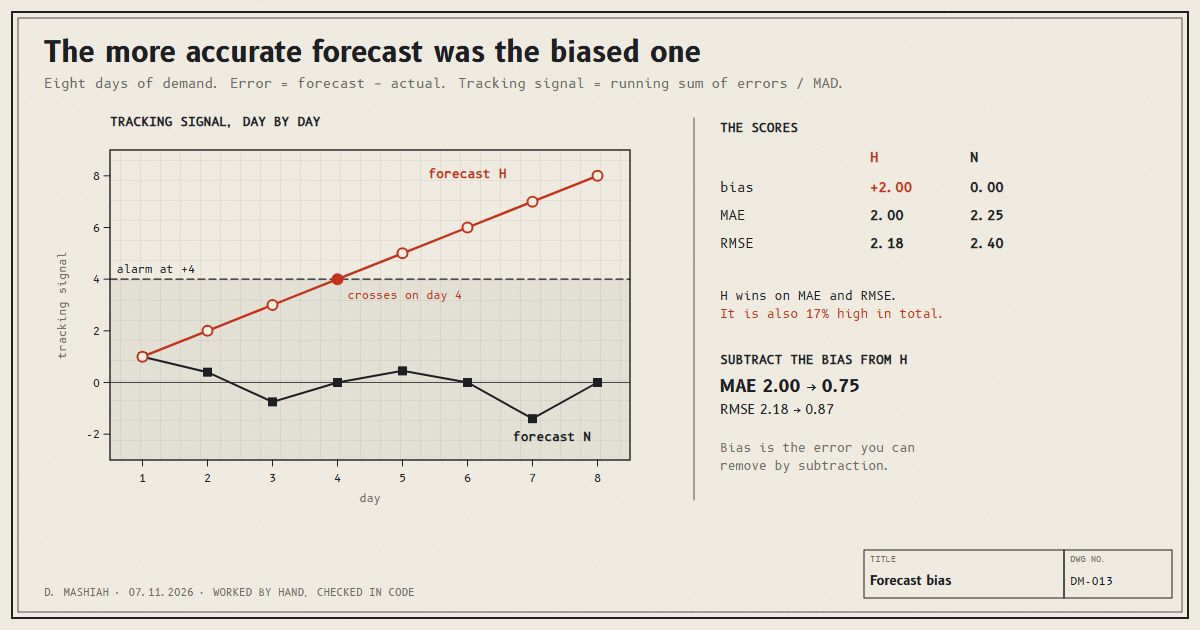
For H the tracking signal goes 1, 2, 3, 4, 5, 6, 7, 8. It reaches the alarm on day 4. For N it goes 1.00, 0.40, −0.75, 0.00, 0.45, 0.00, −1.40, 0.00, never near the line.
Why bias is the cheapest error to fix
Forecast error has two parts. The random part goes both ways, and nothing short of a better model removes it. The bias goes one way, and you can remove it by subtraction.
Take forecast H and subtract its bias of 2 from every day. The errors become +1, −1, 0, +1, −1, 0, +1, −1. MAE falls from 2.00 to 0.75 and RMSE from 2.18 to 0.87. That is far better than N, and it came from one subtraction, not from a new model.
The catch is that a bias found in the past only helps if it continues. Before subtracting it, find out where it comes from. A common source in retail is training on sales instead of demand: on a day that sold out, the recorded sales are lower than what people wanted, and a forecast trained on them learns a bias in the other direction, too low. That case is worked through in the censored demand note.
The practical rule is to report bias next to MAE or RMSE, always. One says how big the misses are. The other says whether they all lean the same way, and only that one can be fixed for free.